Saturday, May 22, 2010

Science Link Dump

Each of these deserves its own post with some comments and development, but it ain't gonna happen. I'm just going to dump.From The Washington Post, trying to figure out how medieval map makers achieved the accuracy they did. No one knows. (But we're pretty sure it wasn't aliens. No, seriously. It wasn't.)The PNW's forgotten volcanic threat: Glacier Peak, from The Everett, WA HeraldNet. It's certainly one I tend to forget about; running through the major Cascade peaks Washington northward, I would typically recall St. Helens, Adams, Rainier, Baker and Garibaldi (in BC). Note that Glacier is missing from my mental list; It's between Rainier and Baker, but difficult to access.
Rogue River-Siskiyou National Forest at the Botany Photo of the Day, found in Julia's shared items. Sigh... plants and rocks and falling water... sigh. I love Oregon.
A recently created Hubble Picture of the Week site at ESA, via Bad Astronomy.
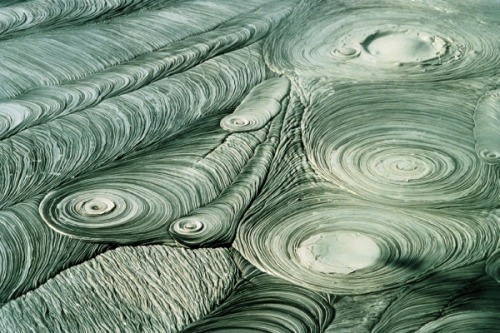
A lovely abstract in New Zealand mudpots; Geology Rocks.
Textural and mineralogical characteristics of unpronounceable ash at Eruptions.
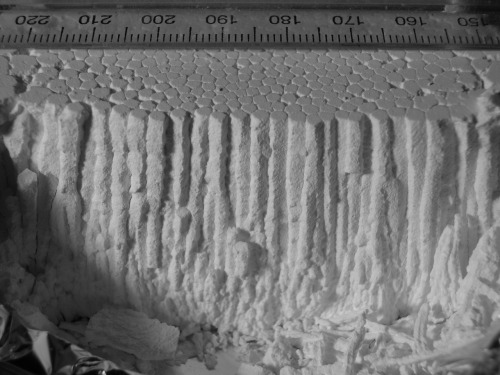
Columnar basalt model with a common kitchen material and water + time, via Geology Rocks. Add coloring for more realism?
California is a world in itself; Hollywood's map of location locations, from Strange Maps.

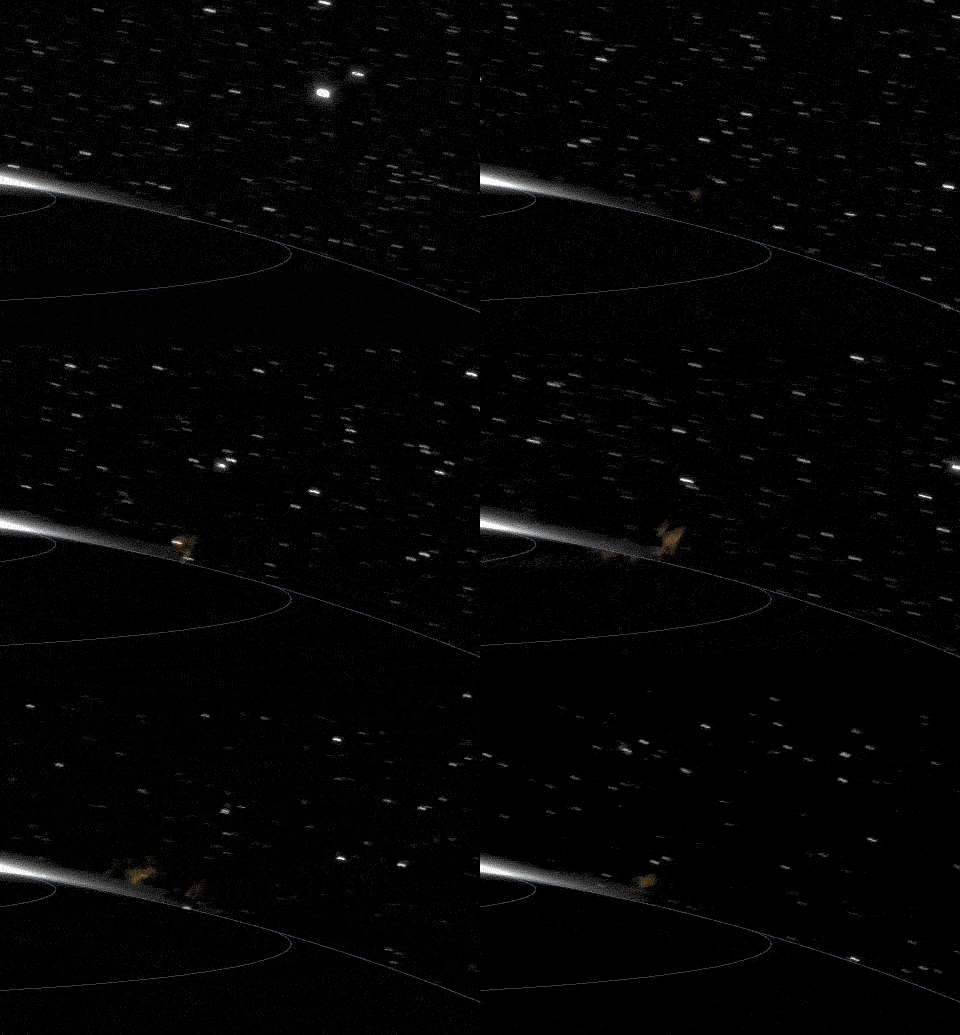
Yesterday's Big Picture was a glorious set of 30 images from Saturn; here's one of them:That's an animation of the first visible wavelength images of the Saturnian Aurora.

Wave Bye-Bye!

Russian engineers and architects who designed this bridge...

...had apparently never heard of this bridge:

First clip via Swans On Tea. I love the pedestrian near the beginning of the first clip; my guess is he's full of vodka, and figures it's just him. Incidentally, the Russian bridge opened in October, roughly seven months ago. I imagine there's a pool gambling on its failure date. It's possible to retrofit and dampen the resonance, I suppose.

Didn't Qualify for Saturd80's

Because it's from 1995. Badtux, that snarkiest of penguins, posted a live version of this the other day, and reminded me how much I enjoy this song and album. Apparently, Elastica is the only album Elastica did that went anywhere, which is too bad. Connection:

And what are the chances! Here's a live cover by the group of a song that did qualify for Saturd80's:

Saturd80's

Oh, my... I had forgotten how much I love this song... and this film... and Talking Heads generally. Slippery People:

I can't figure out how to, or even if it's possible to embed this one. EBN/OZN, AEIOU Sometimes Y. (On further searching, I think it's barred from being embedded, at least in the US.) I think I may have posted this one before, and I'm not finding an English version. But it's the music much more than the words I enjoy here. Trio, Da Da Da:

Finally, The Plimsouls, A million Miles Away. I don't think I've actually heard this song since it was playing on KBVR, 25 years or more ago...

Sane In Comparison

It has been my belief for the last 20 years that both major parties are owned and operated by big business, and under orders to achieve the ends of big business. I just find Democrats- overall- less repugnant. They act at least a little concerned that your ongoing rape might be a wee bit uncomfortable. The Tea Partiers, on the other hand, don't strike me as owned by the corporations. They're much too crazed to be organized and operated by anyone. Nor are they out to metaphorically rape the country. No, they merely want to slowly and deliberately dismember and cannibalize it. Preferably with fava beans and a nice chianti. (comic by Clay Bennett at The Chattanooga Times Free Press.)

Two Questions

Without knowing the flow’s true magnitude, how can anyone judge the success of any approach? Without determining how much oil is beneath the ocean’s surface and how much is floating toward land, how can we best direct response efforts?
An op-ed in today's NYT makes a number of points I've been trying to emphasize, but more clearly and completely than I have managed.
On Thursday, BP was finally forced to acknowledge that far more oil is escaping from its damaged well into the Gulf of Mexico than the oft-repeated estimate of 5,000 barrels per day. Nonetheless, the company still insists that an accurate measurement of the spill rate is neither necessary, as it would do nothing to alter their response efforts, nor is it possible with existing science.

It is our view that accurate, continuously updated measurements are not only possible, but absolutely essential if we are to respond effectively to this and future disasters. That is why we are conducting satellite image analysis and image-based fluid-flow analysis to provide an independent assessment of the oil spill.
Go and read. BP must not be allowed to attempt to sweep this under the rug any further; they've been getting away with just that for a month now. As I've said before, what we can see, even with the slick now washing ashore, and having heart-breaking impacts on people and wildlife, is merely the tip of this still mostly hidden disaster.

Friday, May 21, 2010

Doing Geology

The first two talks I saw yesterday were about ongoing work at the Altiplano Volcanic Complex (APVC) in Chile. Above is a Flash Earth image of the area; click the pic to embiggen or explore further here. I'm certain the image is in the right general area, but I didn't get enough information to know for certain whether it actually covers any of the specific sites under discussion.

I was uncertain exactly what to expect from these GeoDay talks, but they are essentially grad students presenting what they're doing in their research; most have done some of the work, but the focus is not on presenting and defending results and conclusions. Instead, the focus is on the how and why: why is the research relevant or important, and how will it be carried out? After watching eight of these 20-minute presentations, I came away favorably impressed with the format's ability to give students an opportunity to practice their public speaking and presentation skills in a relatively low-risk setting.

The first talk was by Stephanie Grocke, (The links I will attach to each name will take you to the relevant abstract) who is examining melt inclusions to determine whether there was a volatile gradient in the pre-eruption magma chamber. Her talk was the first to really strike me with the realization of how far geochemical measurement techniques have advanced over the last 20-25 years: the resolution is pretty incredible to me. Melt inclusions are tiny bits of original melt that have been isolated within crystals since before eruption, and thus contain a record of the magma as it was originally composed in-situ. One example she showed looked from the scale bar as if it was approximately 100x200 um, or 0.1x0.2 mm... for those who want their dimensions in English, that's about 4 by 8 thousandths of an inch. And that was a large one. The idea that you can accurately measure the composition of anything that small is amazing.

Her hypothesis is that volatile components (CO2 and H2O) were more abundant in the top of the magma chamber, driving the initial Plinian eruption style. Later in the eruption, a decrease in volatiles led to a decreased velocity of the eruptive column, and thus to the column's collapse, resulting in a widespread (and startlingly thick!) ignimbrite deposit. Stephanie visited the area last November and collected samples, and is now in the midst of (what looks to me like) the mind-numbingly tedious process of separating and preparing quartz and feldspar crystals with pristine vitreous inclusions- there's a set of criteria for what constitutes a satisfactory inclusion for analysis- for later compositional analysis. It turns out Stephanie moved to Corvallis from very close by the area from which I moved to Corvallis, within 20 miles or so!

The second talk was by Casey Tierney, working in the same general area, the APVC, but on domes rather than ignimbrites. The task he has set himself is to analyze accessory minerals- notably zircon and sanidine- to get at the thermal history of the magma chambers that erupted to form the domes in question. Zircon starts crystallizing at about 850 C, so the innermost zones of that mineral would record the age at which the magma first cooled to that temperature. Sanidine remains diffusive with respect to Ar essentially until it erupts, so its age effectively measures the eruption's date. The difference between the U/Pb age from zircon and Ar/Ar age from sanidine gives a (minimum?) residence period for the magma in the magma chamber. And again, I'm sort of shocked that there is enough confidence in the accuracy and resolution of these dating techniques to meaningfully get at periods that are certainly going to be small compared to the decay times involved in those radiometric series.

Related questions that can be addressed with residence time include magma source; was it one batch of magma, or were new batches added during the residence time? Also, thermal history; if new batches were added though time, it's possibly a magma chamber could be rejuvinated. Otherwise, one could conclude that the system is slowly cooling. Based on other studies of similar dome complexes in the Andes, Casey provisionally expects to find this field was a single source, and that it is slowly cooling.

I'm going to skip the geography presentations; I found them interesting, but I simply don't know enough to meaningfully discuss what I saw, and worry I'd make a hash of them. If you're interested, you can go back to the GeoDay post and read the abstracts. Certainly the topics are of interest to geo-literate people, but they're far enough away from my knowledge base that I'm hesitant to say much.

At 2:00, Wendy Kelly presented her plans to develop an interpretation training manual for Shenandoah National Park and its employees. To tease that apart a little further, the document is intended to guide and educate rangers and other staff who have frequent contact with the public they serve on the geology and geologic history of the park, and how to help the public understand and appreciate that geology. Wendy's talk focused primarily on the logistics of developing the manual, not on laying out the current knowledge of the geohistory of the area- this might have been a little disconcerting to the "real" geologists in the audience, but was actually kind of a relief for this science educator to see.

As Wendy pointed out, this issue really is one of interpretation- of finding ways to translate complex concepts scientists become accustomed to tossing around with shorthand terminology to language that the general public can understand.

As an offhand example, let's take the phrase "arc-continental collision." To a geoscientist, each of those words carries an abundance of information and presumed assumtions: arc= a chain of volcanoes arising from subduction, partial melting and resultant volcanism, typically in the form of evolved, more silica-enriched melts. Volcanism is often (though certainly not always) in the form of stratovolcanoes. Continent= thickened crust with an overall granitic-granodioritic composition; central (cratonic) area is largely inactive, but may alternate between epicontinental seas and periods of erosion, resulting in a thin (compared to total crust thickness) veneer of mostly horizontal, undisturbed, sediments. Edges may be active- undergoing interactions with adjacent plates (think US west coast), or inactive- attached to (and actually the same "plate"as) adjacent oceanic crust (think US east coast). Collision: two plates collide with each other, typically creating an episode of mountain-building and deformation, and possibly associated volcanism. Afterward the two plates are attached, and will share a common geologic record- though rocks predating the collision may have wildly disparate histories. Now look back at that paragraph. Three simple words, "arc-continental collision"- which also have their own, different, commonly understood colloquial meanings, further confusing the task of interpretation- carry an enormous amount of assumed meaning in a conversation between geologists. And it would be easy for me to expand that paragraph many times to clarify other meanings and assumptions of implied meaning.

But to a member of the general public, none of that shared understanding is there- at least you have to start with that assumption.

So the task Wendy has at hand is to "translate," via careful choices of language, graphic representations, analogies, metaphors and similes, an extremely complex (therefore interesting) geologic record into terms park employees can understand well enough that they can do the same for the public. Not an easy task, but one I'd love to tackle myself.

Overall, her approach is to have four sections: a broad overview/sketch of Appalachian geohistory, a more detailed technical regional overview that delves into the finer points, then a parallel pair of sections at the local level: an overview of the geological, biological and cultural history of the park area, and a technical examination of the historical details.

I had two minor quibbles: Wendy stated that the general public is not terribly interested in geology, and went so far as to say they're afraid of science. I disagree. I've found that the vast majority of people I've interacted with love to learn about the history of the landscape and materials that surround them, but you do have to approach the subject at their level. That can vary tremendously from one person to another, of course. Over the last 20 years, I have come to believe that all human beings have an innate desire to understand the world around them- that's our competitive edge. In terms of physical prowess, there's not much we're terribly good at: we're not specialists. Our prowess is in understanding and predicting behavior in our surroundings, and manipulating those surroundings in ways we believe will benefit us. From that perspective, you can see why I believe it's an innate tendency. What people are afraid of is not science, but that learning science will be more work than it's worth. An interpreter's or educator's job is to get the learner past that fear.

The second quibble is that there was no discussion of an evaluation plan. This is a geology degree, not an education degree, but it's troubling (though very, very common) that these things are produced and put out there with no plan to judge whether it had an effect, or even whether it reached its intended target audience (in this case, visitors to Shenandoah NP).

The final geology presentation I saw was Jennifer Cunningham's on developing better models on trace element partitioning in clinopyroxene. Basically (OMG, awful geopun there... completely unintentional, mind you), clinopyroxene is a very important component of mafic igneous rocks, and having better numerical models of how trace elements partition between those mineral grains and the rest of the melt has the potential to allow better geothermometry (estimating temperatures of petrogenesis) and geobarometry (estimating pressures of petrogenesis).

I have an enormous amount of respect for a student willing to cull data from literally hundreds of articles from the geologic literature (and go through hundreds more only to find they don't have relevant data), then go through the further, and perhaps even more tedious, process of developing a better fit algorithm for something in the range of 15-20 trace elements. That said, this is a project I would never want to do, personally. It could be of enormous utility, but I hope she has a strong background in math and especially computer science. She showed a flow diagram illustrating her approach, but didn't say much about how she would actually develop and tweak her models. From my perspective, not knowing much about computer science or statistics, the only practical way I see is having a computer run through many iterations for each element, finding the best fit for the parameters of interest. She may have more streamlined methods to work with, but I suspect this problem wouldn't even have been possible at the time I graduated; it would have required too much computing power. As it was, this one was right at the edge of what I could comprehend. The thought of the problem is fascinating to me, but the thought of trying to actually tackle it is frankly horrifying,

So there you have the geology portions of the GeoDay afternoon. I enjoyed myself, though I get a little anxious being surrounded by large numbers of people I don't know, and was happy to return to my dark little corner in my favorite coffee shop.

Love Amongst Primates

This clip has been showing up all over the place for the last few days... if you haven't seen it yet, it's a real tear-jerker.

Thursday, May 20, 2010

No Time for Blogging Today!

I went to the afternoon talks at the GeoDay presentations I mentioned Monday, and quite enjoyed them. It wouldn't have been practical to try to liveblog, but I took notes, and hope to write up and comment on at least the geology-oriented talks tomorrow. But my RSS is calling me, with 978 items... if I don't kill some them off, I won't have time to do anything tomorrow.

Wednesday, May 19, 2010

Would You Believe...

Via McClatchy, and based on the video clip I posted yesterday:
Steve Wereley, an associate professor of mechanical engineering at Purdue University, earlier this month made simple calculations from a video BP released on May 12 and came up with a flow of 70,000 barrels a day, NPR reported last week. Werely on Wednesday told a House Commerce and Energy Committee subcommittee that his calculations of two leaks that show up on videos BP released on Tuesday showed 70,000 barrels from one leak and 25,000 from the other.

He said the calculation could be off by 20 percent — meaning the spill could range from between 76,000 to 104,000 barrels a day. But Wereley said he would need to see videos that were not compressed and showed the flow over a longer period so that it would be possible to get a better calculation of the mix of oil and gas from the wellhead.
Missed it by that much. I would reiterate, this is after installing the diversionary pipe that BP is so proudly publicizing today. While they were saying Sunday and Monday that it would capture as much as 1000 barrels per day, they now claim that they're recovering 2000 barrels per day. So it worked. Now about that other 93,000 barrels per day, BP?

Followup: I just noticed that the error range noted above is correct on the lower end, but the upper end should be 114K, not 104.

May 19, 1980

I got really backed up yesterday, spending most of the day reading and blogging about Mt. St. Helens to the exclusion of pretty much all else. Still, I feel like I've hardly scratched the surface; there's just so much to say about this fascinating eruption. Above, adapted from USGS Professional Paper 1250, is a schematic illustrating some of the points I discussed in yesterday's post.

A point I'd like to emphasize today though is how little was known or understood in the days following the eruption. It was clear immediately afterward (or as soon as one woke up, in some cases :p) that it was a disaster of immense proportions. But access was limited- roads were wiped out by the lahars- and dangerous. No one knew what was going to happen next, and aircraft mostly stayed some distance upwind from the mountain.

One issue that I clearly remember was the suggestion that an area much larger than the peak itself had erupted. In retrospect, the features that caused this rumor were phreatic blast craters: (via the CVO Photo Archives)
Spirit Lake, Pumice Plain, and phreatic explosions, soon after the May 18, 1980 eruption of Mount St. Helens. USGS Photograph taken on May 29, 1980, by Dan Dzurision.
These craters were the result of water seeping into the still-hot debris, and causing steam explosions. But I remember the news stations reporting "on-going eruptions" in the area where Spirit Lake had been. No one was even sure if the lake still existed. Here's the front page of "The Paper of Record" on that stunned Monday morning:
The "at least 8 dead" would ultimately rise to a tally of 57, and reading the article, I found myself repeatedly surprised at what was not known, or incorrectly believed.
The earlier ash and steam eruptions this year were dwarfed today, but it is not clear whether lava was being expelled in the absence of a lava eruption, the major worries were drifting ash, which is hazardous to crops, water supplies and health; forest fires, and flash floods resulting from melting glaciers.
Ash is a form of lava, and the statement, "it is not clear whether lava was being expelled in the absence of a lava eruption," is just bizarre to me. If there is an "absence of a lava eruption," it seems it would be a fair assumption lava isn't being expelled. But ash was being expelled, to the tune of nearly a third of a cubic mile. Not to be too mean about it, but this reporter didn't really have a clue. Still, I think the article, from a perspective of 30 years later, does a fine job of illustrating the confusion surrounding the situation in the days immediately following the eruption.

The Oregonian (OregonLive, in it's online incarnation) may have reposted the text of its May 19 stories; if so I haven't seen it. But even in the headline, which is all I can really read, the subtext of confusion is apparent...
Spirit Lake wasn't really gone, of course, but it had been displaced and obscured by the tremendous amount of debris an angry mountain had lobbed at it. Again, access, visibility, incorrect assumptions, and dubious conjectures made clear vision even more difficult than the ash did in those days of havoc. Incidentally, the Oregonian front page above was the one I had two copies of, one until it was too tattered to use as a wall poster anymore, and the other a treasured resident of my files for many, many years. I'm pleased to have another copy. It's from another magnificent large-format photo gallery at OregonLive. There is also a nice gallery of photos of the mountain, the visitor center, and surrounding communities taken this year. Below is another selection from the many mind-boggling pictures there. I still haven't been able to find any clips of even photos of the active lahars after the eruptions... lots from afterwards, but nothing that approaches the haunting mental images I have of the roiling mire, tossing six foot tree trunks around like toothpicks. This one conveys a sense of the difficulty presented by the muck.
Teresa Fiest, 16, gives a helping hand to Oregonian reporter Susan Hobart as the two make their way slowly to the home of Fiest’s brother-in-law. Photo credit: The Oregonian
So while I and many others marked yesterday as "the anniversary" of this event, the fact is that for many, "the event" would last for days, even weeks. And for 57, the event was the last thing they knew.

Tuesday, May 18, 2010

Tuesday Tits

I'm betting you thought I'd forgotten about this feature today, what with MSH@30 and all, didn't you? No way! I think about tits all the time. But what I'm really excited about is that I had been under the impression they were only European birds. I was so wrong. The lovely example above, from here, is called a New Zealand tomtit. And the authoritative source of all knowledge (not) confirms the existence of tits down under.

What Happened At Mt. St. Helens

I have found that most people don't really understand just how Mount St. Helens erupted, so let me explain, using the below video and some screen captures. Before you watch the clip though, I want to explain some things about magma. First, it's hot, maybe in the range of 800 Celsius (in this particular case), ~1350 F. Second, it has a tremendous amount of material dissolved in it that would, under normal surface conditions, prefer to be gasses: carbon dioxide, sulfur dioxide, hydrogen sulfide, and others, but most importantly water. These so-called volatile components make up a small percentage by mass of the solution, but (again, under normal surface conditions) would "prefer" to make up a massive portion of the volume.

You can think of these gases as just like the CO2 in soda pop, except the soda pop is molten rock at 800 C. You know what happens when you shake a bottle of soda, then open it quickly? Even though in terms of total mass, the CO2 is only a small component of the contents of the bottle, it quickly shows that under non-pressurized conditions, it's a very large component in terms of volume. Just to be clear, we ARE talking about gasses dissolved in the magma, not little blobs of hot water under pressure, or little bubbles of gas that expand, but again like soda, gasses actually dissolved in a liquid. A very hot liquid. And under magnitudes greater pressure than those present in bottled soda. It's important to understand that the gas is actually dissolved in the molten rock.

Now watch the video:

At 8:32, 30 years ago today, a magnitude 5+ earthquake shook the mountain. A diagram I did for an earlier post would be helpful here:That red blob in the second section would have been much larger by May 18th, and the north side bulge much more steepened... the mountain had effectively passed the point where the bulge was stable. So it fell off. In the following sequence, the times are those displayed on the video; I don't know how well those times correlate with the real timing of events.t=0 sec; earthquake hits, north side starts to slide slowly; note clouds of dust over the summit.t=2 sec; Slide accelerates. Note that in the first frame, Goat Rocks, the lumpy protrusion in the middle of the mountainside we're facing, is pretty much centered over a hill in the mid-ground. In the second frame, its left edge is now over that hilltop.
t=3 sec; the entire north side of the mountain is sliding now, and tremendous amounts of dust are rising near the summit, and above and to the left of Goat Rocks.
t=5 sec; relieved of support as the first block slides lower, a second block starts to slide from the peak. This one is rooted deeper in the mountain, and the surface of failure intersects the (until now) hidden and confined magma chamber (which, as you may remember, is very hot and under enormous pressure)t=8 sec; the first (right, lower) block continues to collapse, but is slowing and spreading out laterally. The second (left, upper) block is just getting started.t=10 sec; as the second block continues to collapse, it exposes a portion of the magma chamber, and a blast is channeled from the summit.

Brief mathematical interlude... if we assume (fairly conservatively; the number was probably higher) a 2.5% volatile percentage by weight, and a density of 2500 kg/cubic meter, we come up with a mass of volatiles of 62.5 kg/m^3. If we further assume this is all water (which it mostly was), that's the equivalent of 62.5 liters, or .0625 m^3. General rule of thumb- I'm not going to run through the gas laws- a volume of water will expand 1000 fold converting to steam. Magma that until an instant before had been under tremendous confining pressure has now been exposed to normal atmospheric conditions. There's nothing keeping those gasses dissolved in magma- now lava- anymore. They want out. And to a quick and dirty first approximation, each cubic meter of lava has 62.5 cubic meters of gas that want to escape. As I said at the outset, the mass percentage of the volatile component is small, but the amount of volume it will assume at one atmosphere is enormous compared to the volume it occupies in dissolved form.t=12 sec; as the first block slides ever lower against the second, the magma chamber is exposed in a second area. Notice this new exposure is facing sub-horizontally. While the summit exposure directs a blast at the open sky, this second exposure is directed across the landscape to the north. You have probably seen the term "lateral blast" associated with this eruption. While numerous vertical blasts have been seen and recorded in human history, this was the first time people had witnessed and (fortuitously) recorded a lateral blast, though it turns out they're not as uncommon as you might think from that fact.t=16 sec; the summit blast vaults even higher, while the lateral north side blast spreads. I have never been able to tell if the white clouds on the margins are dust (as I described them in the t=3 frame) or actually nuée ardentes- glowing avalanches. (followup: I received a comment that the white areas are avalanches of snow and ice, which makes sense. They had probably been dusted and disguised by preceding ash bursts.)t=18; both blasts expand. An important feature to note is that the blasts start well after the landslides, but have higher velocities than the landslides. The consequence of this in the rock record is that close to the mountain, landslide debris was deposited first, and blast deposits on top of that. Farther from the mountain, blasted material arrived and was deposited first, while the runout and deposits from the landslide arrived later. So close in, blast deposits are on top of landslide deposits, while further out, that sequence is inverted. This was the observation that has allowed volcanologists to recognize lateral blasts at other locations, and one of the reasons Mt. St. Helens is important to the science. Despite impressions, this was not a terribly large eruption. But it was very well documented and observed. Access was (and remains) relatively easy compared to other volcanoes. As a result, an enormous amount has been learned from this eruption and subsequent activity.

I won't make a habit of embedding the same video twice in the same post, but I encourage you to watch it again.

This is based on a classic set of photos taken by a hiker who happened to be in the right place at the right time, and who had a camera ready to go. It actually continues past the conclusion of the clip, as can be seen in this clip. I'll tack on one more frame from that one.I cringe a little when I see the phrase "an earthquake caused the eruption," or words to that effect. It would be accurate to say an earthquake triggered a landslide, releasing an explosive eruption. But what caused the eruption was gas dissolved in magma, and the sudden pressure release which allowed those gasses to catastrophically exsolve. I can think of mechanisms by which this event might have turned out differently... mostly involving plenty of time for the gas to escape more gently, but I think by the time the mountain reached this point, earthquake or no, an explosive eruption was the most likely outcome.

I had intended to point out some of my favorite MSH@30 pieces from geobloggers and other sources today, but the above took longer than I expected. Maybe tomorrow.

Sen. Nelson release of BP leak video 4


This is one of four videos released by Senator Bill Nelson (Florida) of the apparently on-going submarine blowout in the Gulf of Mexico. Note in the right column, second line, "17/05/10." This would have been early yesterday morning (the third line says "01:05:41," and the clip runs for five minutes), a day after BP's much touted "success" at emplacing the diversionary pipe and blocking flanges. The first, second, and third are at the links, but they appear to predate BP's "success."

This is infuriating; here we are a month after the blast and release, and we still don't know 1: what the flow rate is; 2: how many leak points are in the broken riser and blow-out preventer; and 3: therefore have no way to judge what, if any positive effect BP's efforts have had. What we do know is this: 1: BP refuses to provide any information or allow any others to gather it; 2: BP has an apparently unending supply of ad hoc, ad lib strategeries, all of which they are confident will succeed... until they don't; 3: when they don't succeed, it's not really a failure. It's a success of sorts in that they learned something; 4: BP is a kabuki grandmaster, insisting that they will pay for the repercussions of the mess they created, while at the same time making sure that there is no firm data on the mess they created, so their lawyers can stand soberly in court and say the looming dead zones are the result of agricultural runoff. After all, no one really knows how much oil spilled.

Goat sodomizers, every one of them.

And boy-oh-boy, look at this widget I found at Nelson's website:

Followup: The widget isn't showing up for me, though it does show up in preview. Previous experience tells me this may or may not sort itself out, and that it may or may not show up for others. The source is at PBS. It shows the amount of oil estimated to have leaked to date, with an adjustable slider to set the assumed rate of escape.

Abrupt Massive Landslide

I think I've seen clips of this slide before, but this is better lit and higher resolution than I remember. Clearly anticipated (notice the barrier right in front of the edge), nothing seems to happen... then you notice the utility poles starting to tremble and slowly move down and to the left... then all hell breaks loose. Amazing.

Via Bits and Pieces

It Was A Dark and Stormy Morning

The Big Picture has the definitive collection of photographs from the oodles I've seen so far today. As you might imagine, there are lots and lots of articles and blog posts on St. Helens today and over the last few days. I'll probably post several pieces myself today. The above photo (or a very similar one, or perhaps a crop of the above) covered 2/3 of the whole front page of The Oregonian on Monday. I bought two copies, and one was a wall poster for years. The other got filed.

It was shortly after noon today that I woke up for a second time, went out to the community room, where maybe 3 dozen people were crowded around the television, watching... something. It was a hazy, apparently black and white, writhing, seething mass between two walls of trees on either side. Trees would snap off and disappear into it.

"What is that?" I asked, of no one in particular.

Someone glanced over their shoulder and replied, "Mt. St Helens."

I didn't comprehend what I was seeing for quite some time, but I was witnessing a lahar on the Toutle River. I'll keep looking, but I haven't found any clips of those debris flows. But after the above image, my initial glimpse of the volcanic fury that day, ironically debris-choked water, mud and wood, remains, for me, the most iconic image from Mt. St. Helens.

30 Years and About an Hour Ago

I was sleeping off Saturday night in my dorm room on the fourth floor of Hawley Hall, when I was woken by some jerk running down the hall screaming, and had to get up, lean out the door to yell "Shut the fuck up! That's not funny!"

He was yelling "The mountain blew up! St. Helens exploded!"

Blissfully unaware that the announcement was not a Chicken Little case, I went back to sleep for a couple of hours.

Monday, May 17, 2010

30 Years Ago Today

I don't remember what I did, but I can hazard a guess based on what I tended to do on Saturdays during that first term at OSU. I probably woke up late in the morning, say 10-11, and found something to eat. Slogged through some studying. Maybe mid afternoon, took a drive with some friends to explore scenic western Oregon for a while, maybe take a short hike.

By this point (past 8:30 pm), I was undoubtedly drinking large quantities of cheap beer. I know I was up pretty late, and I know I was hung over when I was rudely awoken at about quarter to nine Sunday morning. I also remember I felt much better when I awoke again under my own schedule at about 11:30.

You Did, Brit, You Amnesiac Idiot

Facebook friend TSM posted this video (originally at HuffPo) a little while ago. I gather from the linked article that this was yesterday morning. Though I had read the Times article about the undersea plumes Saturday evening, that was probably too late to affect the scripted talking points.

Still, the closing moments are astounding. Here's the transcript if it offends you to sit through Hume's pretentious intoning:
WILLIAMS: But I think it will damage the environment in the gulf and damage tourism and damage fishing. I don't think there's any question this is in excess of anything we've previously asked the ocean to absorb.


HUME: We'll see if it is. We'll see if it is. The ocean absorbs a lot, Juan, an awful lot. The ocean absorbs a lot.

WILLIAMS: I think Rush Limbaugh went down this road, "The ocean can handle it." I think we have to take some responsibility for the environment and be responsible to people who live in the area, vacation in that area, fish in that area. It's just wrong to think, "You know what? Dump it on the ocean and let the ocean handle it."

HUME: Who said that? Who is saying that? No one's making that argument.

My comment on the FB post was "If the oil concentration in those plumes is 1% of 1% (1/10,000) there's 20 Exxon Valdez' worth in just one of them. How 'bout we give Brit some swim fins and a weight?"

GeoDay

One of the OSU Geoscience faculty members I bumped into here at my favorite coffee shop a couple of weeks ago just sent me a reminder and invitation to the 12th Annual GeoDay! Oooh... this looks like fun!
12th Annual GeoDay
Thursday, May 20, 2010
9:00 a.m. to 3:30 p.m.
203 Wilkinson Hall


GeoDay is a graduate student led research conference at which students are encouraged to showcase their thesis research. Please feel free to stop in anytime to listen to a student presentation. Light snacks and drinks will be provided. See below the the presentation schedule and presentation abstracts.


Schedule
(Click on session title for abstract)

9:00-9:20 - Joe Haxel
The deep ocean ambient sound field - global, regional and local perspectives

9:20-9:40 - Andrew McFadden
Sediment transport rates and surface erosion mechanisms at an oak savanna restoration site in the Willamette National Forest, Oregon

9:40-10:00 - Kendra Hatcher
Long-term trends in streamflow in large basins of western Oregon: disentangling climate change effects and land use legacies

10:00-10:20 - Mousa Diabat

10:20-10:40 - Richardo Gonzalez
Predicting resazurin and Resorufin sorption effects

10:40-11:00- Chris Longton

11:00-11:20 - Julia Cohen
Trace element geochemistry of hydrothermal chlorite and sericite at Yerington, Nevada: developing new methods of exploration for porphyry copper deposits

11:30-1:00 - Lunch and Award Ceremony

1:00-1:20 - Stephanie Grocke
Volatile influence on eruption style at large silicic caldera systems: a melt inclusion study

1:20-1:40 - Casey Tierney
Understanding continental magmatic systems: insights from accessory minerals in lavas from the Altiplano-Puna Volcanic Complex

1:40-2:00 - David Bucklin
Conservation effectiveness in a dynamic colonization zone: forest clearance in and around Amboró National Park and Integrated Management Natural Area, Bolivia

2:00-2:20 - Wendy Kelly
Geology interpretive manual for Shenandoah National Park: educating the public on the four-dimensional aspects of an ancient continental collision zone

2:20-2:40 - Jennifer Cunningham
The testing and derivation of experssions for clinopyroxene/melt trace-element partitioning through the application of new database materials

2:40-3:00 - Tom Hanlon
The impact of the mining legacy in a water scarce South Africa: an environmental security perspective

3:00-3:20 - Bridget Brown
Water governance capacity: using national laws and policies as a baseline assessment - a case study of Jordan


Looks like a continuing geducation opportunity for Lockwood. And Callan: take a gander at that 2:00-2:20 presentation... WOOT!

And thanks to Deepsea Dawn for the invitation to attend and blog about it!

Happy

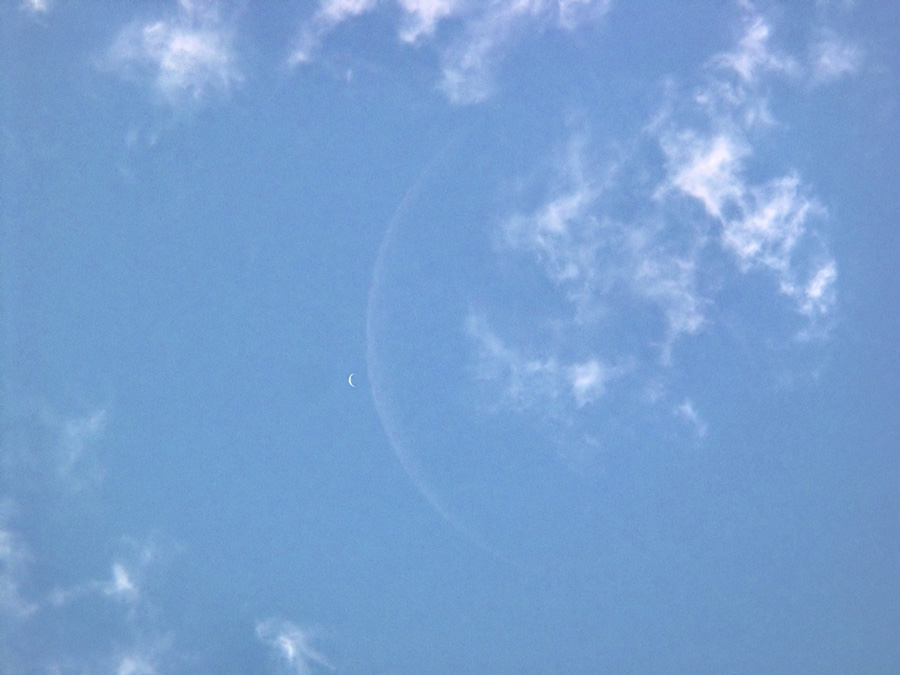
This picture makes me it.Crescent moon, crescent Venus, from yesterday's APOD. This reduced version really doesn't do it justice... click over and see it full-sized.

The Sad, Sick Math of The Gulf Spill

Comrade E.B. Misfit delivers it:
Let's convert to feet and figure the volume of that plume. Rounding off a little, that is 52,800' x 15,800' x 300' = 250,272,000,000 cubic feet. There are 7.48 gallons in a cubic foot. If that plume were comprised of 100% oil, that would be 1,872,034,000,000 gallons of oil, or nearly two trillion gallons in that one plume.

Even if that plume were comprised of just 0.1% oil by volume, that would still mean that this oil spill is approaching two billion gallons of oil, which is over two hundred times more oil than the Exxon Valdez spill. And that volume of oil would assume that the plume contains all of the oil spilled, which it does not.
The only thing I would add is that this is one plume (albeit the largest observed, so far) of at least a few that have been identified. It does not include oil that may be still on the sea floor, nor oil on the surface. There also may be plumes that haven't been discovered and identified yet. BP is still resisting getting good data on the flow rate, saying that it is irrelevant to the problem at hand, getting the leak halted. Yeah, whatever.

Sunday, May 16, 2010

Good News, Bad News

This is too depressing to write much about... the good news is, they got the diversionary pipe in place, and are now piping some of the oil from the riser to the surface, hopefully lowering the amount spilling into the ocean.
At the oil-leak site, a tube five-feet long and four inches in diameter was pushed into a leaking riser that’s 21 inches in diameter _ the source of most of the spill. The inserted tube has three large flexible rubber diaphragms to keep it in the riser and block oil and water from mixing; however, BP officials said the riser is still leaking some oil.
The bad news is that evidence is mounting that the actual amount that has been leaking over the last three weeks is at least 10 times larger than the official estimate of 5000 barrels- 210,000 gallons- per day. I've seen estimates as high as 80K (again, per day). How could the estimates be that far off? That brings me to another little bit of "good" news.

The dispersants injected at the wellhead are doing just what they're intended to do: allow oily surfaces to stick to watery surfaces. This means the oil breaks up into beads and globs- sort of like salad dressing. It also means the oil rises to the surface more slowly than it otherwise would. The official estimate is based on the size of the oil slick and estimates of its thickness. Yesterday (printed in this morning's edition) The NYT reported that massive submarine plumes of water-oil emulsion have been discovered. The largest found so far is three miles by ten miles by 300 feet thick. There are apparently a number of these plumes, at varying depths. Marine currents move differing directions at differing depths, so the oil is headed in a number of directions, independent of whatever is happening on the surface. But at least that minimizes the impact on the ecosystem, right?
Dr. Joye said the oxygen had already dropped 30 percent near some of the plumes in the month that the broken oil well had been flowing. “If you keep those kinds of rates up, you could draw the oxygen down to very low levels that are dangerous to animals in a couple of months,” she said Saturday. “That is alarming.”
(...)
Dr. Joye said the findings about declining oxygen levels were especially worrisome, since oxygen is so slow to move from the surface of the ocean to the bottom. She suspects that oil-eating bacteria are consuming the oxygen at a feverish clip as they work to break down the plumes.
I commented to someone earlier that I don't think you could have come up with a more effective plan to simply kill the Gulf of Mexico. Despite the increasing number of oil-soaked animals being photographed, I don't even think we've seen the tip of this iceberg.